
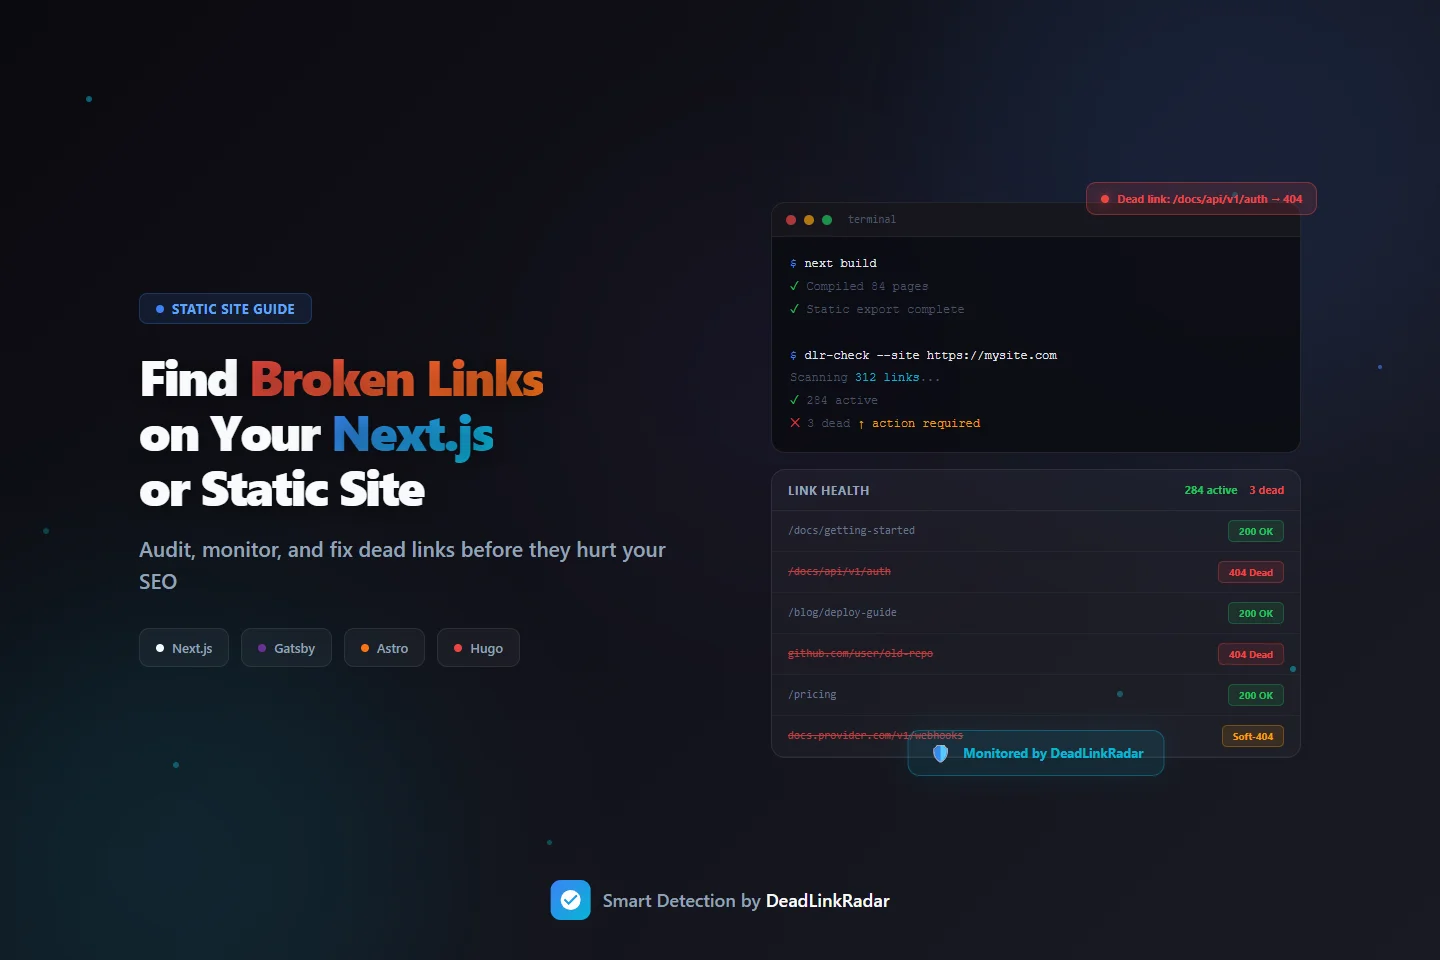
You deployed a clean build. Every page compiled. Zero TypeScript errors. And somewhere in those 300 links, three are silently returning 404s to real visitors—and you have no idea.
That's the broken link problem unique to static sites and frameworks like Next.js, Gatsby, Astro, and Hugo. There's no plugin to catch it. No CMS safety net. The build passes whether links work or not. Links break after deploy—when an external API changes, when you refactor a route, when a third-party docs page moves—and there's nothing in your pipeline to tell you.
This guide shows you how to find broken links on a Next.js or static site, set up continuous monitoring, and get alerts before your users encounter dead links in production.
Why Static Sites Have a Broken Link Problem
Traditional CMS platforms like WordPress have a rich plugin ecosystem specifically designed to catch broken links. Every major CMS ships with or supports tools that crawl your content and flag dead URLs. Static site generators have no equivalent safety net.
When you ship a Next.js or Gatsby site, your broken link checker options out of the box are essentially zero. The build process validates your code—not whether the URLs in your content are alive. A link to an external documentation page can break an hour after you deploy, and your CI/CD pipeline will never flag it. The next morning, visitors land on a 404 with no indication anything went wrong.
The problem compounds because static sites tend to be documentation-heavy, content-rich, or technically precise—exactly the kind of sites where broken links do the most damage. A developer reads your docs, clicks a reference link that returns 404, and questions whether your docs are maintained at all. The credibility hit is immediate.
What Creates Broken Links on Static Sites
Understanding why links break helps you prioritize which ones to monitor most closely.
Route refactors. Next.js makes it easy to reorganize your routing structure—moving pages from /blog/[slug] to /articles/[slug], or flattening nested routes during a site architecture overhaul. Internal links that were valid before the refactor become dead links after deploy. If those internal links appear in blog posts, documentation, or marketing pages, every inbound visitor following a shared URL hits a wall.
External API and documentation changes. Static sites commonly link to external technical references: API docs, GitHub repositories, library changelogs, SDK guides. Third-party documentation moves constantly. Provider v1 docs get archived. GitHub repos get renamed or deleted. Libraries get deprecated. None of these changes trigger any signal on your end—you just have broken links until someone reports them.
Build artifact and CDN link drift. Sites using external CDNs for assets, or linking to specific build artifacts (release downloads, versioned assets), are vulnerable to URL changes on the provider's side. A link to a specific release tag on GitHub or a versioned asset on a CDN can break when providers change their URL structure.
Third-party embed and reference rot. Content sites link to external sources as citations or further reading. Academic papers move. Blog posts get deleted. Company homepages change URLs after rebrands. Over time, these reference links decay at a predictable rate—typically 3–5% of external links per year stop working.
App Router migrations. Next.js App Router introduced new routing conventions that differ significantly from Pages Router. Sites migrating between routing systems often end up with changed URL structures. Any externally shared URL from before the migration is a potential dead link after—and external sites that linked to you can't update those links automatically.
Step 1: Find Broken Links Before You Launch
Before any deploy, run a one-time audit to establish a link health baseline. This catches broken links that exist in your source content—internal links to routes that don't exist, or external links that are already dead before you ship.
Extract All Links from Your Static Site
The first step is getting a complete list of every URL your site references. For static sites, this means parsing your built output or your source MDX/Markdown files.
For Next.js and similar frameworks, the easiest approach is to scan the built HTML output after next build and next export:
# After next build + next export, scan the /out directory
grep -roh 'href="[^"]*"' ./out/ | \
  grep -oP 'href="\K[^"]+' | \
  sort -u > links.txt
For Gatsby, Astro, or Hugo, the pattern is the same—scan whatever directory contains your built HTML files (public/, dist/, etc.):
# Gatsby / Astro / Hugo: scan the public directory
grep -roh 'href="[^"]*"' ./public/ | \
  grep -oP 'href="\K[^"]+' | \
  grep "^http" | \
  sort -u > external-links.txt
This gives you a flat file of every URL your built site references—both internal (relative paths) and external (absolute URLs).
Check Links Before Importing
Once you have your list of links, you want to verify them without adding them blindly to a monitoring service. DeadLinkRadar's URL classification feature lets you validate and preview links before committing them to monitoring. Paste your extracted URLs, and you'll see a classification of each one—active, dead, redirecting, or soft-404—before you import.
This pre-import step is especially useful for one-time launches where you want to find and fix broken links before they go live, rather than monitoring them reactively.
Fix Before You Ship
For each dead link you find in the audit:
| Issue | Fix |
|---|---|
| Internal link to nonexistent route | Update the link target or create the missing route |
| External link returning 404 | Find the new URL, or remove the reference |
| External link returning a soft-404 | Review the page content—may need replacement |
| Redirect chain | Update to point directly to the final destination |
The goal isn't just to remove broken links—it's to ship with confidence that every link in your content is valid on day one. A clean link audit before launch also gives you a baseline: you know exactly which links were healthy at deploy time, which makes it easier to identify regressions later.
Scanning Source Files Instead of Built Output
If you prefer to check links before building, you can scan your source MDX or Markdown files directly:
# Scan source MDX files for external links
grep -roh 'https\?://[^)"'\''> ]*' ./content/ | \
  sort -u > external-links.txt
This approach catches dead links earlier in your workflow—before you spend time on a full build. The tradeoff is that it doesn't catch links generated dynamically by framework components, which only appear in the built HTML.
For most content-heavy Next.js or static sites, scanning source files first for a quick check and built output for a comprehensive audit is the right combination.
Step 2: Set Up Continuous Broken Link Monitoring
A one-time audit catches problems at launch. But links break after you deploy, not just before. You need continuous monitoring that checks your links on a schedule and alerts you the moment something goes dead.
Bulk Import Your Links
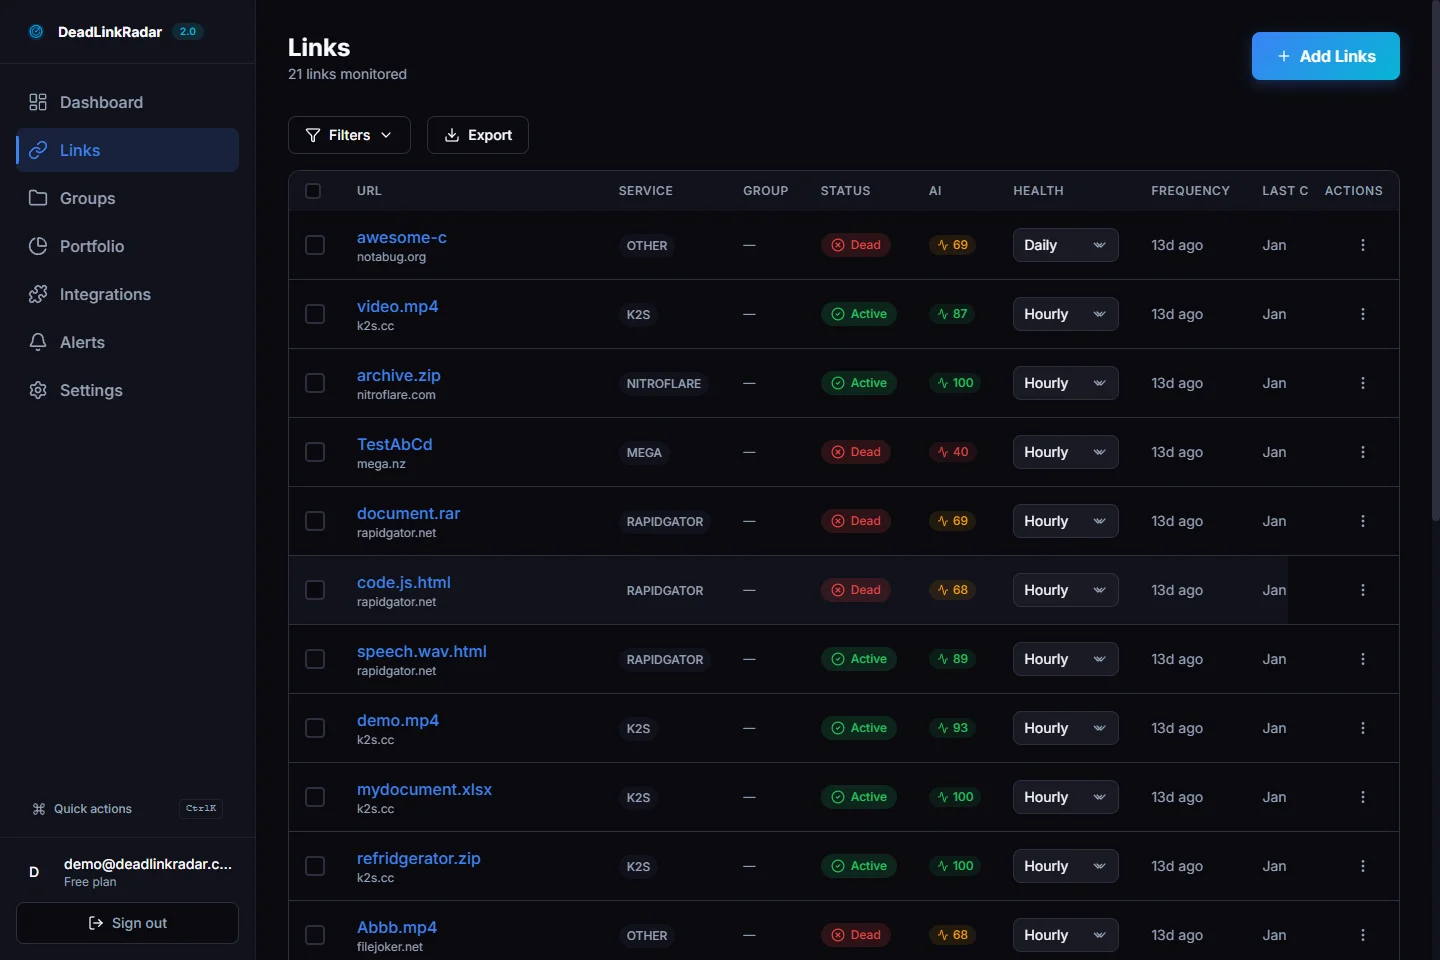
After your audit, import your complete link list into DeadLinkRadar. The bulk import accepts a plain text file or CSV with one URL per line—paste the links.txt file you extracted from your build output directly.
During import, configure your monitoring preferences:
- Check frequency: Daily for documentation sites and content sites; hourly for sites with high-value external references (third-party integrations, partner links)
- Groups: Tag links by section (docs, blog, marketing) so you can filter and report by area
- Alert channels: Connect at least one notification channel before finishing import
For Next.js sites, consider separating your monitoring by content type:
- Internal routes monitored daily (your own routes don't break often, but route refactors happen)
- External documentation links monitored daily
- Third-party integration reference links monitored hourly (providers deprecate paths frequently)
Automate Post-Deploy Link Submission
For teams that push frequent updates, manual bulk imports aren't sustainable. You can automate link submission using DeadLinkRadar's monitoring endpoint, triggered from your CI/CD pipeline after each deploy.
Here's a GitHub Actions step that submits newly added links after every successful deploy:
# .github/workflows/deploy.yml
- name: Submit new links to monitoring
  if: github.ref == 'refs/heads/main'
  run: |
    # Extract links from built output
    grep -roh 'href="[^"]*"' ./out/ \
      | grep -oP 'href="\K[^"]+' \
      | grep "^http" \
      | sort -u > /tmp/links.txt

    # Submit to DeadLinkRadar
    curl -X POST https://deadlinkradar.com/api/v1/links/batch \
      -H "Authorization: Bearer ${{ secrets.DLR_API_KEY }}" \
      -H "Content-Type: application/json" \
      -d "$(jq -R -s -c 'split("\n") | map(select(length > 0)) | map({url: ., check_frequency: "daily"})' /tmp/links.txt | jq '{links: .}')"
This runs after every main branch deploy, submitting any new external links for monitoring. Links already in your account are deduplicated automatically—you don't end up with duplicate monitoring entries.
For more complex setups—filtering by domain pattern, excluding certain paths, or tagging links by content section—use a custom extraction script:
// scripts/submit-links.ts
import { execSync } from 'child_process'

const builtOutputDir = './out'
const apiKey = process.env.DLR_API_KEY

// Extract all external links from built HTML
const html = execSync(`grep -roh 'href="[^"]*"' ${builtOutputDir}`).toString()
const urls = [...html.matchAll(/href="(https?:\/\/[^"]+)"/g)]
  .map(m => m[1])
  .filter(url => !url.includes('deadlinkradar.com'))
  .filter((url, i, arr) => arr.indexOf(url) === i) // deduplicate

await fetch('https://deadlinkradar.com/api/v1/links/batch', {
  method: 'POST',
  headers: {
    'Authorization': `Bearer ${apiKey}`,
    'Content-Type': 'application/json',
  },
  body: JSON.stringify({
    links: urls.map(url => ({ url, check_frequency: 'daily' })),
  }),
})

console.log(`Submitted ${urls.length} links for monitoring`)
Run this at the end of your deployment pipeline, and every new external link you ship is automatically enrolled in monitoring.
When to Monitor Internal vs. External Links
Not all links need the same treatment. Internal links (routes within your own site) and external links have different failure modes and monitoring needs.
| Link Type | Failure Cause | Recommended Frequency |
|---|---|---|
| Internal routes | Refactors, file renames, routing changes | Daily |
| External documentation | Provider archives old versions | Daily |
| GitHub repositories | Repo renamed, made private, or deleted | Daily |
| Third-party integrations | Provider changes URL structure | Hourly |
| Affiliate / partner links | Partner site moves, expires, or restructures | Hourly |
| CDN assets | Provider restructures storage, retires versions | Daily |
This tiered approach avoids over-monitoring stable links while catching high-risk external references quickly.
Step 3: Set Up Alerts for Your Team
Monitoring without alerts is just logging. The value of broken link monitoring is knowing the moment something breaks—before a user reports it or Google penalizes your page.
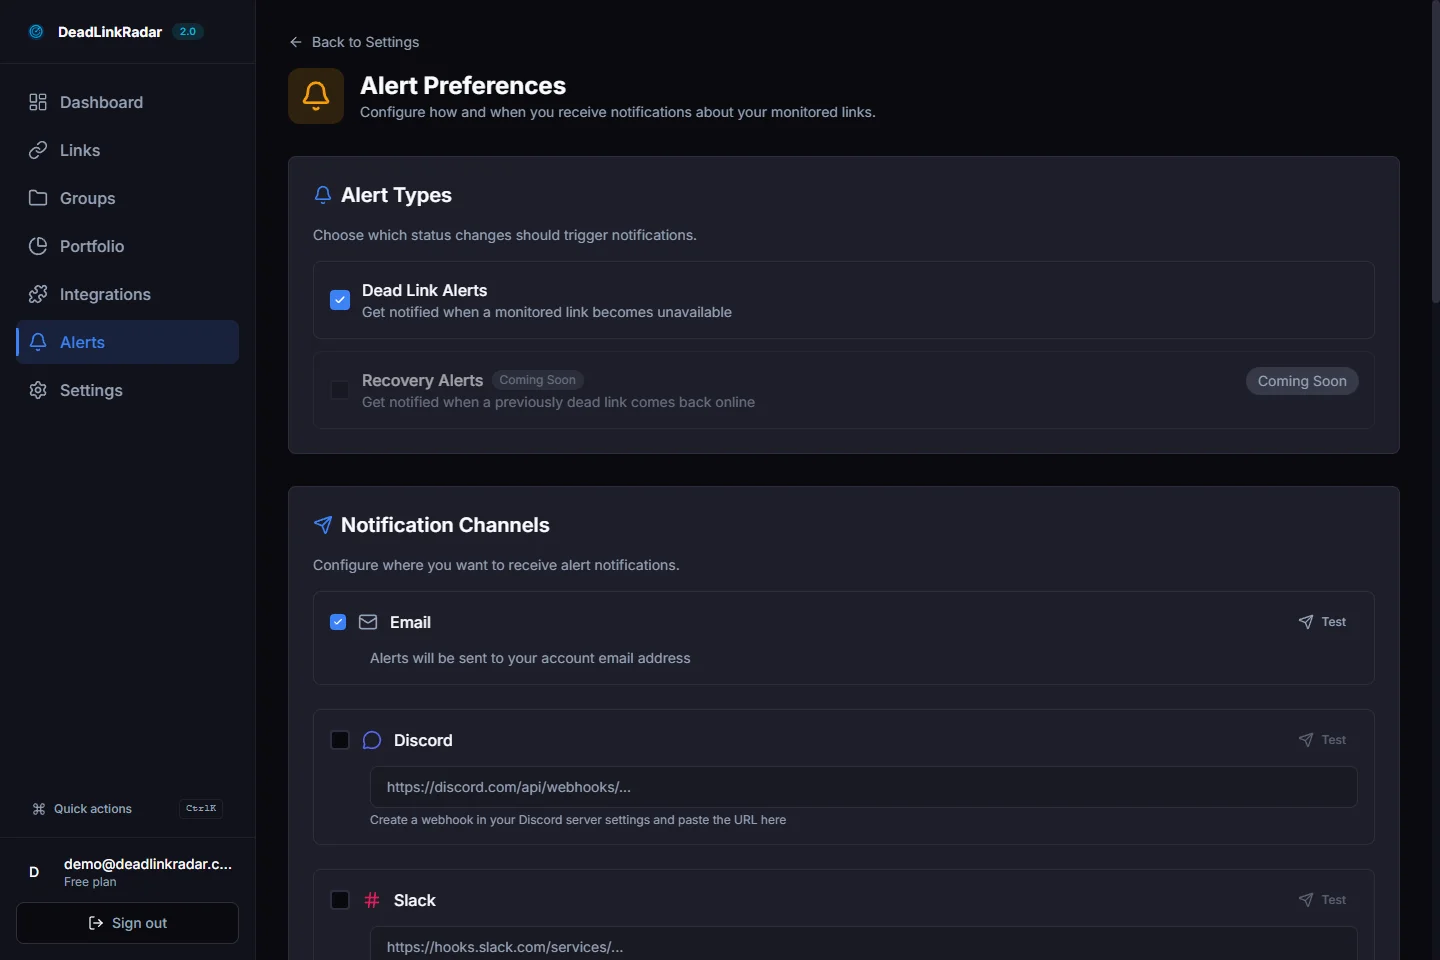
Choose Alert Channels for Development Teams
Static sites and JAMstack projects are typically maintained by developers, not marketing teams. This changes which alert channels are most useful.
Slack or Discord — Most development teams have a dedicated #site-alerts or #infra channel. DeadLinkRadar can post directly to any Slack or Discord channel with a simple webhook URL. Configure broken link alerts to post there immediately when a link goes dead.
Email digest — For lower-urgency monitoring (weekly link health summary for documentation or blog content), a weekly email digest is less disruptive than instant Slack alerts for every failure.
Webhook — If your team uses a custom alerting system, PagerDuty, or another incident management tool, the generic webhook integration lets you route alerts anywhere.
For a typical Next.js or static site setup, we recommend:
- Instant Slack alerts for any link returning 404 or timing out
- Weekly email digest showing overall link health trends
- Separate alert threshold for high-priority sections (docs, getting started guides)
Alert Fatigue and Confidence Scoring
The worst outcome from any monitoring tool is ignoring alerts because they're too noisy. Static site link monitoring can generate false positives—a documentation provider's server has brief downtime, a CDN returns a temporary 503, a rate limit triggers a transient 429.
DeadLinkRadar uses confidence scoring to filter signal from noise. Rather than alerting on every non-200 response, the monitoring service tracks patterns across multiple checks before issuing a dead-link alert. A link that returns 503 once but is healthy on the next check doesn't trigger an alert. A link that consistently returns 404 across three consecutive checks does.
This means your Slack channel gets an alert when something is genuinely broken—not when a third-party server has a five-minute hiccup.
Common Broken Link Patterns on Static Sites
Knowing what to look for accelerates your response when links break. These are the patterns we see most often on Next.js and static sites.
Next.js Route Changes
The App Router introduced nested layouts and new file conventions that differ significantly from Pages Router. During migrations or refactors, some URLs shift unexpectedly:
# Common route structure changes in Next.js migrations
/blog/[slug]         →  check: /articles/[slug] ?
/api/v1/check        →  usually stable, but verify
/docs                →  depends on catch-all routing
/guides/[category]   →  may change with new folder structure
After any significant routing change, run a fresh link audit against your deployed site—not just your local dev build. Middleware, redirects, and dynamic routing can behave differently in production.
External Documentation Versioning
Providers version their documentation URLs. A link to docs.provider.com/v1/getting-started becomes a dead link when they ship v2 and archive v1. This is a slow burn—the link works for months, then silently 404s when the provider retires the old version.
Monthly monitoring on external documentation links catches these before they accumulate. Set check frequency to daily for any links pointing to third-party guides or SDK references.
GitHub Repository Changes
GitHub links are common in technical documentation—references to example repos, issue templates, code snippets. Repos get renamed, transferred to organizations, made private, or deleted. A link that worked when you wrote the doc can break any time the repo owner changes settings.
Monitor GitHub links the same way you monitor any external URL. When a repo goes private or gets deleted, your alert fires within the next check cycle.
CDN and Asset URL Drift
If your site links to versioned assets on external CDNs—release downloads, versioned packages, or third-party media—those URLs can break when providers restructure their storage or retire old versions.
Group CDN links separately in your monitoring dashboard. When an asset URL breaks, the fix is almost always updating the link to point to the current version—a quick edit and redeploy.
Integrating with Your Development Workflow
The most effective link monitoring doesn't require developers to think about it. The goal is zero ceremony—links get checked automatically, alerts surface in the right channels, and fixes are fast.
Pre-Commit Hook (Optional)
For teams that want to catch broken links before they're even committed, a pre-commit hook can run a quick check on any new URLs added to MDX or Markdown files:
# .husky/pre-commit
#!/bin/sh
# Extract new external links from staged files
git diff --cached --unified=0 | \
  grep "^+" | \
  grep -oP 'https?://[^\s"<>]+' | \
  sort -u > /tmp/new-links.txt

# Exit early if no new links
[ -s /tmp/new-links.txt ] || exit 0

# Check each link
while read url; do
  status=$(curl -s -o /dev/null -w "%{http_code}" --max-time 5 "$url")
  if [ "$status" = "404" ]; then
    echo "Dead link detected: $url (404)"
    exit 1
  fi
done < /tmp/new-links.txt
This is a lightweight check—it won't catch soft-404s or redirect chains. But it prevents obviously broken links from being committed in the first place.
Continuous Monitoring as the Core Layer
Pre-commit hooks catch links on the way in. Continuous monitoring catches links that break after they're in production. Both layers are valuable, but continuous monitoring is the essential one—because most links don't break at commit time, they break months later when the external resource changes.
DeadLinkRadar's monitoring runs independently of your deploy cycle. You don't need to trigger it, remember to run it, or build it into your CI/CD pipeline. Links get checked on schedule, alerts fire when things break, and your dashboard shows the current health of every URL you're monitoring.
How Broken Links Affect Static Site SEO
Developers often think of link health as a user experience issue. It's also a significant SEO issue—and on static sites, the impact can be harder to notice because there's no CMS workflow flagging problems.
Crawl budget waste. Googlebot has a finite number of requests it will make to your site per crawl cycle. When it follows links to pages returning 404, those requests are wasted. For documentation sites with hundreds of external references, a significant percentage of crawl budget can be consumed by dead link verification.
Link equity loss. If external sites link to a page or document that you've moved without a redirect, that backlink equity goes nowhere. The page it used to support no longer exists to benefit from it. Static sites that do refactors without careful redirect management lose link equity silently.
Quality signal degradation. Google's quality algorithms evaluate whether a site is well-maintained. A site with consistent broken links across documentation pages and blog posts scores lower on quality signals than a site with clean, working URLs. For technical sites where authority matters—developer tools, documentation, technical blogs—this has a measurable ranking impact.
Long-tail traffic decay. Documentation pages and technical guides often rank well for long-tail queries over time. When a broken link on one of these pages drives users to bounce immediately, it sends a negative engagement signal to search engines. Identifying and fixing broken links on high-ranking content pages preserves that traffic.
Getting Started with Link Monitoring for Your Static Site
Whether you're running a documentation site built with Next.js, a marketing site on Gatsby, a blog on Astro, or technical docs on Hugo, the monitoring setup is the same three steps:
- Audit — Extract all links from your built output and find broken links before your next deploy
- Import — Bulk import your link list into DeadLinkRadar with appropriate check frequencies
- Alert — Connect your Slack or Discord channel so broken links surface in the right place immediately
Static sites are fast, secure, and low-maintenance—until broken links start accumulating silently. Continuous link monitoring gives you the same visibility that CMS platforms provide through plugins, without the server overhead or plugin ecosystem.
Start monitoring your static site links free. Import your first links in under 60 seconds—no credit card required. Paste your URL list, configure your alert channel, and DeadLinkRadar handles the rest.
Questions about setting up monitoring for your specific stack? Reach us at support@deadlinkradar.com.