
A link is broken. You know that much. But when did it break? Was it yesterday? Last week? An hour ago? Without knowing the timing, you're debugging in the dark. Did the hosting provider have an outage? Did someone move the file? Did a DNS change propagate incorrectly? The answer often hides in the timeline.
Link status history transforms reactive firefighting into proactive monitoring. Instead of discovering broken links when users complain, you can trace exactly when failures began, identify patterns that predict future issues, and understand whether problems are temporary blips or permanent failures. This visibility changes how you approach link health management.
This guide shows you how to use DeadLinkRadar's status history features to track link health over time, understand uptime trends, and diagnose why links fail when they do.
What You'll Learn
By the end of this guide, you'll be able to:
- View complete check history for any monitored link, including timestamps, response times, and error details
- Understand uptime statistics and what they reveal about link reliability
- Filter history by status to quickly find active or dead checks
- Navigate between links efficiently while preserving your workflow context
- Spot patterns in link failures that help you diagnose and prevent future issues
- Use referrer sources to trace where broken links originate
Whether you're managing a few important download links or monitoring thousands of URLs across multiple properties, understanding status history helps you respond faster and prevent recurring problems.
Prerequisites
Before diving in, make sure you have:
- A DeadLinkRadar account — Free or Business plan works. Sign up here if you haven't already.
- At least one link added to your account with check history. If you just added links, wait for the first automatic check (based on your frequency setting) or trigger a manual check.
- Some check history — The more history you have, the more useful the trends and statistics become. Even 3-5 checks provide useful baseline data.
Don't have links yet? Check out our bulk import guide to add multiple links quickly.
Understanding the Link Details Page
Every link in DeadLinkRadar has a dedicated details page showing its complete history and statistics. This page is your primary tool for understanding link health over time.
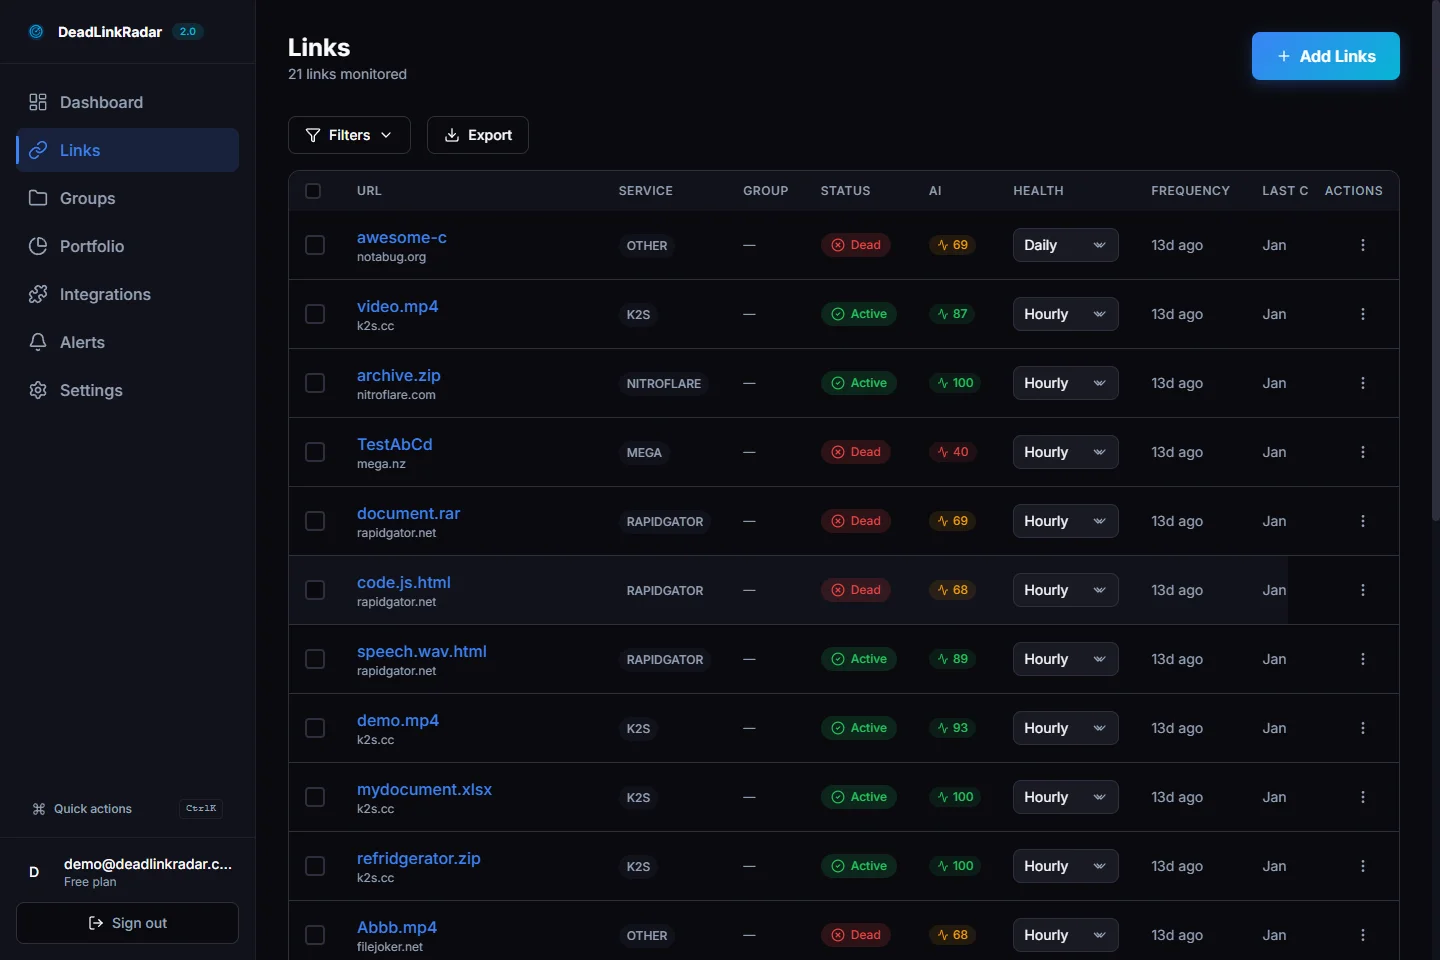
Accessing Link Details
From your main links dashboard, click any link URL to open its details page. You can also navigate directly to /dashboard/links/{link-id} if you have the link ID.

Link details header showing URL, status, and quick actions (click to view full size)
The header section displays:
- URL and current status — The full link URL with a colored badge showing current status (Active, Dead, Checking, or Unknown)
- Service type — What type of link this is (HTTP, file hosting service, etc.)
- Check frequency — How often automatic checks run (hourly, daily, weekly, or monthly)
- Last checked — When the most recent verification occurred
- Quick actions — Copy URL, open in new tab, or trigger an immediate check
The Check Now button is particularly useful when you've just fixed a broken link and want to verify the fix immediately rather than waiting for the next scheduled check.
Reading the Stats Cards
Below the header, three statistics cards summarize your link's health at a glance. These numbers tell the story of link reliability over its monitored lifetime.

Stats cards summarizing link health metrics (click to view full size)
Uptime Percentage
The uptime percentage shows how often the link returns "active" status when checked. A link with 95% uptime was active for 95 out of every 100 checks.
What uptime numbers mean:
| Uptime | Interpretation |
|---|---|
| 99-100% | Excellent reliability. Minor, rare issues only. |
| 95-98% | Good reliability. Occasional failures, likely temporary. |
| 90-94% | Moderate reliability. Worth investigating failure patterns. |
| Below 90% | Problematic. Frequent failures indicate a systemic issue. |
Keep in mind that uptime is calculated from all recorded checks. A link with only 5 checks has less statistical significance than one with 500 checks. Early in monitoring, a single failure can dramatically affect the percentage.
Average Response Time
Response time measures how quickly the destination server responds during checks. This metric helps identify performance degradation before links actually break.
Reading response time trends:
- Fast (< 500ms) — Healthy, responsive servers
- Moderate (500ms - 2s) — Normal for some services, but worth monitoring
- Slow (2s - 5s) — Performance issues likely; may indicate server strain
- Very slow (> 5s) — Risk of timeouts; investigate server health
A gradual increase in average response time often precedes outages. If you notice response times climbing steadily, it's worth checking on the destination server before it fails completely.
Total Checks
This count shows how many verification checks have been recorded. Combined with your check frequency, you can estimate how long you've been monitoring this link.
Example: 168 checks with daily frequency means roughly 24 weeks (about 6 months) of monitoring history.
More checks provide better statistical confidence in uptime percentages and response time averages. If you've just started monitoring and only have a few checks, the stats may not yet represent typical behavior.
The Check History Table
The heart of the link details page is the check history table, showing every verification attempt in chronological order.
Check history table with status, response time, errors, and timestamps (click to view full size)
What Each Check Records
Every check captures four key pieces of information:
| Column | Description |
|---|---|
| Status | Result of the check: Active (working), Dead (broken), or Unknown (error during check) |
| Response Time | How long the server took to respond in milliseconds |
| Error | For failed checks, the specific error message explaining why |
| Checked At | When the verification occurred (shown relative: "2 hours ago", "3 days ago") |
Filtering by Status
The filter tabs above the table let you focus on specific types of checks:
- All — Shows every check in history
- Active — Shows only successful checks where the link was working
- Dead — Shows only failed checks where the link was broken
The Dead filter is especially useful for debugging. When investigating a broken link, filter to dead checks to see all failures in sequence. This reveals:
- How often the link fails
- Whether failures cluster around specific times
- What error messages accompany failures
Understanding Error Messages
When a check fails, the Error column shows what went wrong. Common error messages include:
| Error Type | What It Means |
|---|---|
| 404 Not Found | The page or file no longer exists at this URL |
| 403 Forbidden | Access is blocked (authentication required or IP restricted) |
| 500 Internal Server Error | The destination server is having problems |
| Connection timeout | Server didn't respond within the timeout window |
| DNS resolution failed | The domain name doesn't resolve to an IP address |
| SSL certificate error | HTTPS certificate issues (expired, invalid, or mismatched) |
These error messages help you diagnose root causes. A 404 suggests the content moved or was deleted. A timeout suggests server load or network issues. An SSL error points to certificate configuration problems.
Loading More History
By default, the table shows recent checks to keep page load fast. Click Load More at the bottom to retrieve older history. The system fetches additional records in batches, allowing you to scroll back through months of check data if needed.
Navigating Between Links
When reviewing multiple links, the navigation controls at the top of the page let you move efficiently without returning to the main list.

Previous and Next navigation for reviewing links in sequence (click to view full size)
How Navigation Works
The Previous and Next buttons move through your links in the same order as your main links list. If you sorted by "last checked" on the links page, navigation follows that order. Sort by URL, and navigation follows alphabetical order.
This preserves your workflow context. You can sort links by status to group dead links together, then click into the first one and use Next to review each broken link without repeatedly returning to the list.
Back to Links
Click Back to Links to return to your main links dashboard while preserving any filters or sorting you had applied.
Referrer Sources: Where Links Come From
For links discovered through site crawling or bulk import, the details page may show a Sources section indicating where each link was found.

Referrer sources showing where the link was discovered (click to view full size)
This information helps you:
- Locate where to fix broken links — If a link is dead, you know which pages reference it
- Understand link importance — Links referenced from multiple pages are higher priority
- Audit specific sections — See which parts of your site have the most external dependencies
Common Patterns and Debugging
Status history reveals patterns that help diagnose issues. Here's what to look for and what it typically means.
Pattern 1: Sudden Single Failure
What you see: Link was active for weeks, then suddenly shows one dead check, then active again.
What it means: Likely a temporary server issue, brief maintenance window, or network hiccup. If it's recovered and stays active, no action needed.
Action: Monitor for recurrence. If single failures happen regularly (weekly, for example), there may be scheduled maintenance you should account for.
Pattern 2: Intermittent Failures
What you see: Link alternates between active and dead status over multiple checks.
What it means: The destination server has reliability problems, or there's a geographical/network issue affecting some checks but not others.
Action: Check response times on successful checks. If they're trending up, the server may be overloaded. Consider reaching out to the content owner if it's an external resource.
Pattern 3: Response Time Climb Before Failure
What you see: Response times gradually increase from 200ms to 500ms to 2s over several checks, then the link goes dead with a timeout error.
What it means: The destination server was under increasing load before it failed. Classic symptom of server overload or resource exhaustion.
Action: This pattern often precedes predictable outages. If you control the server, investigate resource usage. If external, this context helps you report the issue to the owner.
Pattern 4: Permanent Failure After Specific Date
What you see: Link was active through a certain date, then every check after that is dead.
What it means: Something changed permanently—file deleted, page moved, domain expired, or server configuration changed.
Action: The timestamp of the first failure tells you when to investigate. Check if there were server migrations, domain changes, or content updates around that date. The error message often indicates whether it's a 404 (content removed) versus a DNS failure (domain issue).
Pattern 5: SSL Certificate Errors
What you see: Link suddenly starts failing with SSL/certificate errors after being active.
What it means: The SSL certificate expired, was revoked, or was replaced with one that doesn't match the domain.
Action: If you control the server, renew or fix the certificate. If external, report to the site owner. Certificate errors are usually quick fixes once identified.
Pro Tips for Power Users
Combine History with Alerts
Status history is most powerful when combined with alert notifications. Configure alerts (email, Discord, Slack, or webhooks) to notify you immediately when links change status. Then use history to investigate the details and context around each failure.
See our alerts guide for configuration details.
Check Before Major Events
Before launching marketing campaigns, product releases, or high-traffic events, review the history of all involved links. Look for:
- Recent failures that might recur
- Response time trends suggesting capacity issues
- Any intermittent problems that could embarrass you at the wrong moment
Then trigger manual checks to verify everything is working right before launch.
Use History for Reporting
When reporting to stakeholders about link health, export key statistics:
- Overall uptime percentage across monitored links
- Number of failures detected and resolved
- Average response time trends over time
History data provides concrete metrics for demonstrating the value of link monitoring and justifying the effort invested in maintenance.
Track Provider Reliability
If you use file hosting services or external platforms, history reveals their reliability patterns. A service that regularly causes failures might not be worth using despite other benefits. Compare uptime and response time trends across different providers to inform vendor decisions.
Summary
Link status history transforms how you understand and respond to broken links. Instead of reacting to user complaints, you can:
- Pinpoint exactly when failures began and correlate with known events
- Identify patterns that predict future issues before they cause problems
- Distinguish temporary blips from permanent failures to prioritize your response
- Track provider reliability over time with concrete data
- Report confidently on link health with historical metrics
The next time a link breaks, you won't just know that it's broken—you'll know when, how, and have the context to understand why.
Next Steps
Ready to put status history to work?
- Add your links if you haven't already — Bulk import makes it fast
- Configure alerts to get notified immediately when issues occur — Alerts guide
- Set appropriate check frequencies to build meaningful history — Batch operations guide
- Review your highest-traffic links first — prioritize the links where downtime costs you most
Questions about link history or need help interpreting patterns you're seeing? Reach out at support@deadlinkradar.com